
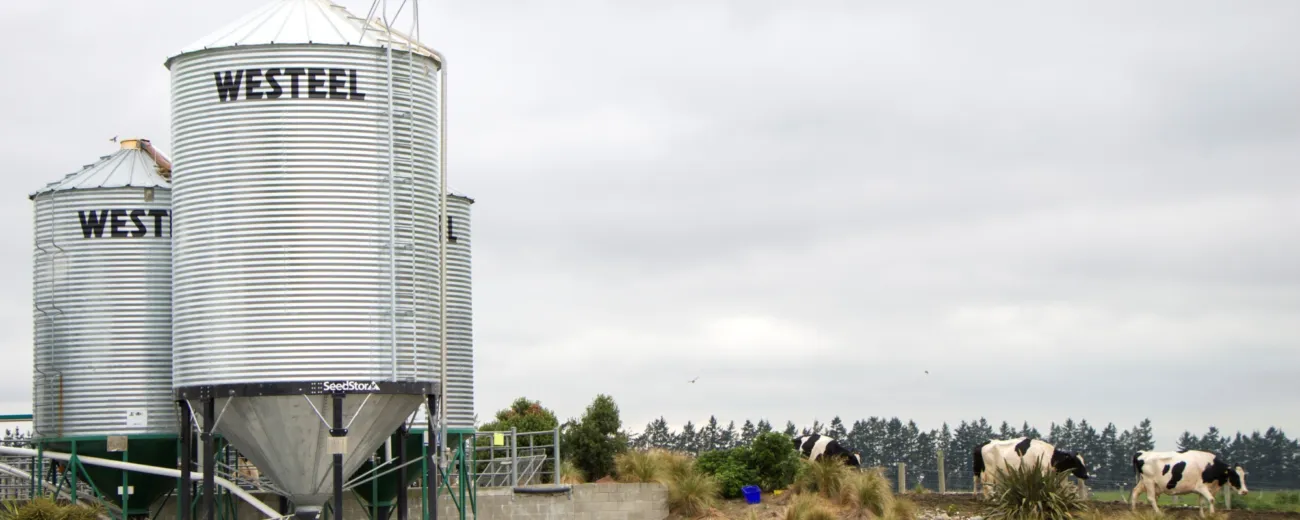
A FAR project is helping arable and dairy farmers understand more about the greenhouse gas emissions associated with growing and using feed wheat, feed barley, maize grain and maize silage.
Updated greenhouse gas emissions profiles have been released for four New Zealand-grown arable animal feed crops. Read the full report here
The figures, which cover feed wheat, feed barley, maize grain and maize silage, all commonly fed to dairy cattle, are available in a report commissioned by the Foundation for Arable Research (FAR) that uses real New Zealand arable grower data to generate the carbon footprints.
FAR CEO Scott Champion says the report is part of a larger FAR focus around supporting a better understanding of the arable sector and generating robust evidence to support the effective use of arable products, in this case in the context of animal feed.
“When New Zealanders think about end uses for wheat and barley, they often assume our grains are for human consumption in products such as bread or beer. However, 75% of the cereal grains grown in New Zealand are eaten by animals. New Zealand has a pasture based dairy system, but these products, along with feeds like maize grain and silage, are important supplements when pasture growth or available nutrients don’t meet the cow’s needs.
“We are working, with dairy, to understand the nutritional and environmental requirements of dairy systems, and how New Zealand arable growers can help to meet them.”
He says the results are valuable for both the arable farmers who grow feed wheat, feed barley, maize grain and maize silage, and the dairy farmers who are their largest end users.
FAR commissioned the Ag: LCA team at the Bioeconomy Science Institute (BSI) (formerly AgResearch) to carry out this research as they are an independent research organisation whose methods are internationally recognised and widely used across the food and fibre sector in New Zealand.
Ivan Lawrie, FAR’s General Manager, Operations noted that “we know from the questions we receive from both arable growers and dairy farmers that they are looking for this sort of information to help them to accurately calculate and then reduce their emissions. Using the Ag: LCA team at BSI means the figures stand up to industry and international scrutiny and the unique contribution of this work is that it uses real New Zealand arable grower data around management and yields to generate the carbon footprint”.
What were the numbers?
Table 1 Production-weighted national average cradle-to-gate carbon footprint for New Zealand grown dried feeds delivered to the point of storage (e.g. silo, bunker).
Crop | Emission Factors | Weighted SD |
Maize silage | 0.18 kg CO2e /kg DM | ±0.04 |
Barley grain | 0.21 kg CO2e /kg grain (14% MC) | ±0.05 |
Maize grain | 0.31 kg CO2e /kg grain (14% MC) | ±0.08 |
Wheat grain | 0.30 kg CO2e/kg grain (14% MC) | ±0.02 |
MC = moisture content; DM = dry matter; SD = production-weighted standard deviation; CO2e = Carbon dioxide equivalent.
How were the numbers worked out?
A group of 23 arable growers from across New Zealand contributed their crop production and management information to this project. This data was used to create a national average carbon footprint for each of the crops selected using a life cycle assessment methodology.
FAQ
What is a carbon footprint?
A carbon footprint is the total amount of greenhouse gases released when a product is created.
What are greenhouse gases?
Greenhouse gases (GHGs) are gases that are present in the atmosphere and trap heat. Greenhouse gases include carbon dioxide (CO2), methane (CH4), water vapour (H2O), nitrous oxide (N2O), ozone (O3) and artificial chemicals such as chlorofluorocarbons (CFCs). The main GHGs emitted in the growing of annual crops such as cereals are: nitrous oxide (N2O) and carbon dioxide (CO2). Ruminant livestock (e.g. sheep and cattle) emit methane (CH4).
What are agricultural GHG emissions and how are they calculated?
Typically the term “emission” refers to the loss of greenhouse gases that are generated during productive activity on farm.
Carbon emissions
A term typically used to describe greenhouse gas emissions in carbon dioxide equivalents. This term could be used to describe net or gross emissions.
Gross emissions
All greenhouse gas emissions created for a given activity or product. For a paddock of grain or seed this would include emissions created via operations such as cultivation, sowing, inputs (e.g. chemicals, fertiliser or irrigation), harvesting, storage and transport to a mill or other end user.
Emission intensity
Emission intensity is an estimate of greenhouse gas production per unit of product. A simple example is for arable feed production where net emissions for a business would be reported as kg CO2-e, whereas emission intensity would be kg CO2-e/t grain.